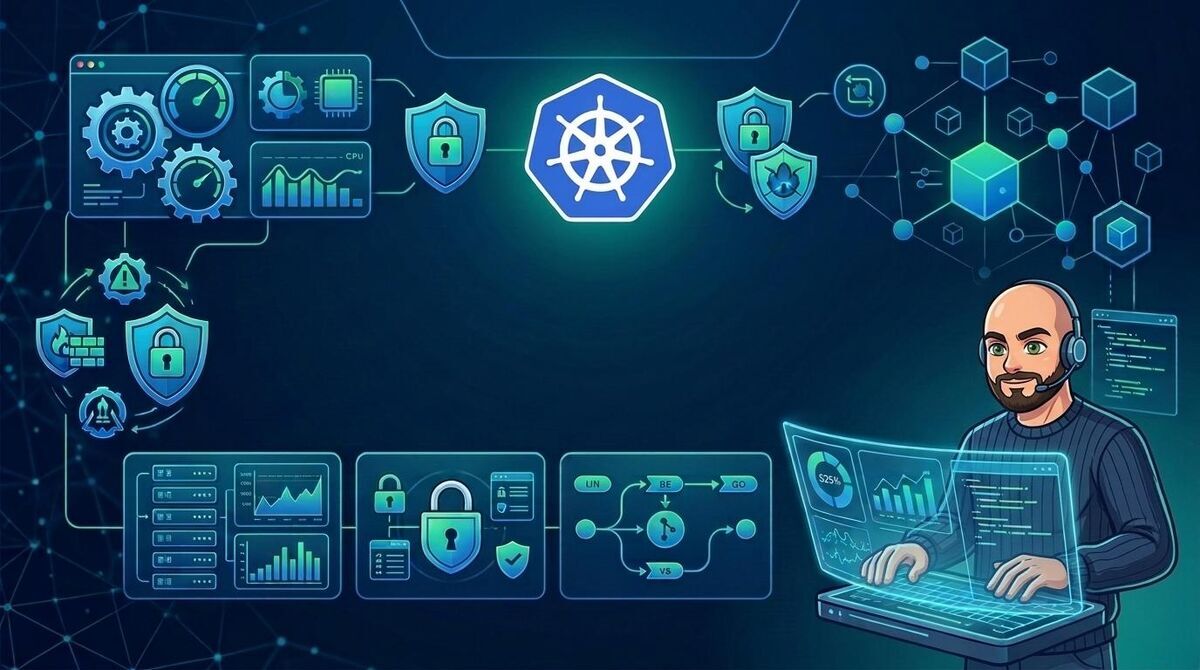
Kubernetes Production Best Practices: A Principal SRE's Playbook
"An advanced, battle-tested engineering guide to operating Kubernetes at scale: resource QoS, eliminating 502 errors, PDBs, Topology Spread, runtime hardening, and observability."
Any Kubernetes cluster can run workloads in staging or development. However, when you promote those exact same manifests into high-throughput production environments with continuous rollouts and routine automated node maintenance, the abstraction quickly cracks unless deliberate architectural choices are made.
As a Principal SRE after a decade of operating multi-region fleets spanning tens of thousands of compute cores, I have witnessed how the most severe outages do not stem from control plane failures (etcd or kube-apiserver), but from subtle misconfigurations in pod lifecycle semantics, flawed assumptions about the Linux kernel, and flat networking topologies.
In this deep-dive technical playbook, we will dissect the five pillars required to architect and operate mission-critical Kubernetes workloads with true resilience, determinism, and enterprise-grade security.
1. Resource Management & QoS Classes: Eliminating Throttling and OOMKills
One of the most widespread misconceptions in Kubernetes adoption is assuming that the scheduler (kube-scheduler) and the underlying Linux kernel treat computing resources identically.
Under the Hood: Requests vs Limits
Kubernetes separates resource constraints into two decoupled mechanisms:
requests: Evaluated exclusively by thekube-schedulerwhen determining node placement. If a node lacks available capacity (based on the sum of requests across existing pods), the pod remains inPending. Requests directly translate to kernel-level reservations in cgroups (cpu.sharesandmemory.min/memory.low).limits: Enforced by the container runtime (such ascontainerdorCRI-O) via Linux kernel cgroups controllers (cgroups v1/v2). This defines the absolute ceiling that the container can never exceed.
# resources-example.yaml
resources:
  requests:
    cpu: "500m"
    memory: "512Mi"
  limits:
    cpu: "1000m"
    memory: "1024Mi"
The Pitfall of CFS Quota CPU Throttling
Unlike memory (which is non-compressible), CPU is compressible. When a container attempts to exceed its CPU limit, the kernel does not kill the process; it throttles it.
In Linux, CPU limits are enforced using the Completely Fair Scheduler (CFS) Quota:
- Quota is tracked over fixed time slices (by default
cpu.cfs_period_us = 100000µs, or 100 milliseconds). - If you set
limit: 500m(0.5 cores), your container is allocated 50 milliseconds of run time per 100ms window. - If a multithreaded application bursts and consumes its 50ms allowance during the first 10ms of the window, the kernel freezes its threads for the remaining 90ms.
[!WARNING] Production Pitfall: An application can appear to run at a modest 20% average CPU utilization in Prometheus, yet suffer massive P99 latency degradation due to ongoing millisecond-level CFS throttling.
Production SRE Recommendation:
- For latency-sensitive workloads (HTTP APIs, gRPC microservices), strongly consider setting no CPU limits (
limits.cpu: null), provided you establish accuraterequests.cpuand namespace quotas (ResourceQuota). - If compliance policies mandate CPU limits, provision generous overhead (at least 2x to 3x above requests) and continuously monitor
container_cpu_cfs_throttled_periods_total.
Memory Dynamics and the OOM Killer (Exit Code 137)
Memory cannot be throttled. When a container exceeds its limits.memory:
- The memory cgroup controller triggers the Linux kernel Out-Of-Memory (OOM) Killer.
- The primary process is terminated immediately with
SIGKILL(exit code137). - Kubernetes annotates the container termination reason as
OOMKilled.
[!NOTE] When building alerts or sizing memory, avoid relying on
container_memory_usage_bytes, as it includes the operating system’s page cache, which can be reclaimed under memory pressure. Always trackcontainer_memory_working_set_bytes.
Strategic Quality of Service (QoS) Class Selection
Kubernetes automatically categorizes every pod into one of three QoS tiers based on its request/limit configuration:
| QoS Class | Definition | Eviction Priority Under Node Pressure | Production Use Case |
|---|---|---|---|
Guaranteed |
requests == limits for both CPU and Memory across all containers in the pod. |
Last to be evicted. Assigned oom_score_adj = -997. |
Mission-critical workloads, databases (PostgreSQL, Redis), ingress routers, core stateful systems. |
Burstable |
requests < limits for at least one resource or container. |
Evicted after BestEffort pods when nodes face memory pressure. | General web microservices, async message workers, transactional APIs. |
BestEffort |
No requests or limits declared whatsoever. | First to be terminated immediately upon any resource contention (oom_score_adj = 1000). |
Batch non-critical jobs, ephemeral testing tasks. Never for production. |
2. Pod Lifecycle & Real Healthchecks: Zero 502 Errors During Rolling Updates
A production cluster constantly transitions state: rolling deployments, HPA autoscaling events, Karpenter node consolidations, and security patch node drains. If pod termination semantics are decoupled from data plane routing, end users will experience HTTP 502 Bad Gateway errors and dropped connections.
The Termination Race Condition
When Kubernetes terminates a pod (e.g., during a rollout restart), two concurrent, asynchronous workflows trigger:
Workflow 1 (Network Data Plane):
Kube-apiserver -> EndpointSlice Controller -> kube-proxy / eBPF -> iptables/IPVS updated on each worker node

Workflow 2 (Container Lifecycle):
Kubelet -> Container Runtime -> Sends SIGTERM to the application container
Due to network propagation delays across distributed nodes, Workflow 2 is almost always faster than Workflow 1. The application receives SIGTERM, tears down its listening socket, and exits before kube-proxy or Cilium have pruned its IP from every node’s forwarding table. Result: incoming requests route to a dead socket -> 502 Bad Gateway.
The Remedy: The preStop Hook and terminationGracePeriodSeconds
To guarantee zero-downtime rollouts, force the container to pause its shutdown sequence until the network routing tables have cleanly removed its endpoint:
# zero-downtime-lifecycle.yaml
spec:
  terminationGracePeriodSeconds: 60
  containers:
    - name: api-service
      image: registry.example.com/api:v2.4.1
      lifecycle:
        preStop:
          exec:
            command: ["/bin/sh", "-c", "sleep 15"]
How This Defense Operates:
- When deletion is initiated,
kubeletexecutes thepreStophook (sleep 15). - While sleeping for 15 seconds, the container keeps its existing sockets open and continues serving in-flight traffic.
- Concurrently, the EndpointSlice controller purges the pod IP from all node iptables/IPVS rules and ingress proxies.
- After 15 seconds,
kubeletissuesSIGTERM. - The application enters its internal graceful shutdown sequence: completing pending HTTP requests and rejecting new ones with
Connection: close. - If the application has not fully exited within the remaining 45 seconds (
60s - 15s),kubeletdeliversSIGKILL.
Production Healthchecks: Startup, Liveness, and Readiness
Misconfigured probes are one of the most frequent triggers of self-inflicted cascading cluster failure.
# probes-best-practices.yaml
startupProbe:
  httpGet:
    path: /healthz/startup
    port: 8080
  initialDelaySeconds: 5
  periodSeconds: 5
  failureThreshold: 30 # Grants up to 150s (30x5s) startup runway

readinessProbe:
  httpGet:
    path: /healthz/ready
    port: 8080
  periodSeconds: 5
  timeoutSeconds: 2
  successThreshold: 1
  failureThreshold: 2

livenessProbe:
  httpGet:
    path: /healthz/live
    port: 8080
  periodSeconds: 10
  timeoutSeconds: 2
  failureThreshold: 3
Golden Rules for Probes:
startupProbe: Critical for workloads with non-trivial initialization times (JVM/Spring Boot services, Node.js engines loading in-memory models). PreventslivenessProbefrom prematurely killing booting containers.readinessProbe(Critical Anti-Pattern): NEVER probe external dependencies (databases, Redis caches, downstream APIs) inside a microservice’s readiness check. If your database experiences momentary latency, every pod in your fleet will fail its probe simultaneously, removing 100% of endpoints from your service mesh and turning a partial degradation into a total cluster outage.livenessProbe: Keep it minimal. Its only job is to detect unrecoverable internal deadlocks. Do not use liveness probes if the application process crashes cleanly upon unhandled exceptions.
3. High Availability & Resilience in the Scheduler
Configuring replicas: 3 does not guarantee high availability if the kube-scheduler places all three replicas onto the same physical node or into an Availability Zone (AZ) experiencing cloud provider degradation.
Topology Spread Constraints: The Modern Standard
Historically, teams used podAntiAffinity to spread replicas across failure domains. In large-scale clusters (>100 nodes), however, calculating anti-affinity requires $O(N \times M)$ comparisons, introducing severe scheduling latency.
topologySpreadConstraints provides the native, high-performance alternative:
# topology-spread.yaml
spec:
  topologySpreadConstraints:
    # 1. Evenly distribute across cloud Availability Zones (Multi-AZ)
    - maxSkew: 1
      topologyKey: topology.kubernetes.io/zone
      whenUnsatisfiable: DoNotSchedule
      labelSelector:
        matchLabels:
          app: payment-api
    # 2. Evenly distribute across individual nodes within each zone
    - maxSkew: 1
      topologyKey: kubernetes.io/hostname
      whenUnsatisfiable: ScheduleAnyway
      labelSelector:
        matchLabels:
          app: payment-api
maxSkew: 1: Restricts the maximum difference in pod counts between any two topology zones to 1.whenUnsatisfiable: DoNotSchedule: Hard enforcement. If nodes are unavailable in an under-represented zone, pods will not stack into overloaded zones, preserving genuine multi-AZ fault tolerance.
PodDisruptionBudget (PDB): Guarding Against Voluntary Eviction
A PodDisruptionBudget dictates how many pods can be concurrently unavailable during voluntary node drain operations (e.g., kubectl drain, automated AMI rotation, Karpenter node termination).
# pdb.yaml
apiVersion: policy/v1
kind: PodDisruptionBudget
metadata:
  name: payment-api-pdb
spec:
  minAvailable: "50%"
  selector:
    matchLabels:
      app: payment-api
[!CAUTION] Cluster Upgrade Deadlock: Never configure
minAvailable: 100%ormaxUnavailable: 0. This halts the node drain eviction controller completely, deadlocking automated cluster upgrades and node maintenance. For single-replica services, usemaxUnavailable: 1if brief downtime is permissible, or scale to $\ge 2$ replicas before attaching a PDB.
4. Runtime Security Hardening: The Zero Trust Pod
Kubernetes security must operate under the assumption that application code can and will be compromised. The mission of runtime hardening is blast-radius containment: preventing container escapes and blocking lateral movement across the cluster.
Hardened Pod Spec with securityContext
The following deployment adheres strictly to the Restricted profile of the official Kubernetes Pod Security Standards (PSS):
# secure-deployment.yaml
apiVersion: apps/v1
kind: Deployment
metadata:
  name: secure-service
spec:
  replicas: 3
  selector:
    matchLabels:
      app: secure-service
  template:
    metadata:
      labels:
        app: secure-service
    spec:
      # Pod-level security context
      securityContext:
        runAsNonRoot: true
        runAsUser: 10001
        runAsGroup: 10001
        fsGroup: 10001
        seccompProfile:
          type: RuntimeDefault
      containers:
        - name: app
          image: registry.example.com/app:1.2.0
          # Container-level security context
          securityContext:
            allowPrivilegeEscalation: false
            readOnlyRootFilesystem: true
            capabilities:
              drop:
                - ALL
          volumeMounts:
            # Ephemeral RAM-backed scratch space for required writes
            - name: tmp-volume
              mountPath: /tmp
      volumes:
        - name: tmp-volume
          emptyDir:
            medium: Memory
            sizeLimit: 64Mi
Breakdown of Security Directives:
runAsNonRoot: true&runAsUser: 10001: Guarantees the container never executes as UID 0. If an attacker breaches the runtime sandbox, they land on the host with an unprivileged UID.allowPrivilegeEscalation: false: Prohibits processes from acquiring additional privileges viasetuidorsetgidbinaries.readOnlyRootFilesystem: true: Renders the container image immutably read-only. Malicious actors cannot download secondary exploitation kits, overwrite system shared libraries, or persist modified binaries. Any scratch disk needs are satisfied via dedicated, ephemeralemptyDirvolumes.capabilities: drop: ["ALL"]: Strips every POSIX kernel capability (such asCAP_NET_RAWorCAP_SYS_ADMIN), neutralizing the overwhelming majority of container breakout vectors.seccompProfile: type: RuntimeDefault: Filters prohibited system calls (syscalls) to the host kernel using the container runtime’s hardened profile.
Network Isolation: Default-Deny Architecture
By default, Kubernetes networking is flat: any pod can communicate directly with any other pod across any namespace. In enterprise production, this is a serious vulnerability.
Every production namespace should begin with an unconditional default-deny policy:
# 1-default-deny-all.yaml
apiVersion: networking.k8s.io/v1
kind: NetworkPolicy
metadata:
  name: default-deny-all
  namespace: production
spec:
  podSelector: {} # Targets all pods in the namespace
  policyTypes:
    - Ingress
    - Egress
With zero-trust isolation enforced, define granular, explicit allowlists:
# 2-allow-app-traffic.yaml
apiVersion: networking.k8s.io/v1
kind: NetworkPolicy
metadata:
  name: allow-secure-service
  namespace: production
spec:
  podSelector:
    matchLabels:
      app: secure-service
  policyTypes:
    - Ingress
    - Egress
  ingress:
    # Allow ingress exclusively from the Ingress Controller
    - from:
        - namespaceSelector:
            matchLabels:
              kubernetes.io/metadata.name: ingress-nginx
          podSelector:
            matchLabels:
              app.kubernetes.io/name: ingress-nginx
      ports:
        - protocol: TCP
          port: 8080
  egress:
    # 1. Authorize CoreDNS name resolution in kube-system
    - to:
        - namespaceSelector:
            matchLabels:
              kubernetes.io/metadata.name: kube-system
          podSelector:
            matchLabels:
              k8s-app: kube-dns
      ports:
        - protocol: UDP
          port: 53
        - protocol: TCP
          port: 53
    # 2. Authorize outbound egress to primary PostgreSQL database
    - to:
        - podSelector:
            matchLabels:
              app: postgres-primary
      ports:
        - protocol: TCP
          port: 5432
5. SRE Observability & Day-2 Operations
Dozens of Grafana dashboards do not mean you have observability. In enterprise clusters, telemetry must be anchored directly around the Four Golden Signals: Latency, Traffic, Errors, and Saturation.
Essential PromQL Queries for Proactive Alerting
Rather than monitoring superficial CPU counters, base your alerts on cAdvisor and kube-state-metrics telemetry that directly forecast degradation:
1. CFS CPU Throttling Ratio
Measures the percentage of periods where containers are throttled by CPU quotas:
sum(rate(container_cpu_cfs_throttled_periods_total{container!=""}[5m])) by (namespace, pod, container)
/
sum(rate(container_cpu_cfs_periods_total{container!=""}[5m])) by (namespace, pod, container) * 100 > 25
SRE Threshold: Sustained values above 25% over 5 minutes indicate artificial latency degradation due to undersized CPU limits.
2. Working Set Memory Saturation (Predicting OOMKills)
Tracks the true percentage of allocated memory limit consumed by active memory:
(
  container_memory_working_set_bytes{container!=""}
  /
  kube_pod_container_resource_limits{resource="memory"}
) * 100 > 85
SRE Threshold: Alerting at 85% gives on-call engineers actionable lead time before the kernel OOM killer terminates the pod.
3. Pods Stuck in Pending or CrashLoop States
Quickly reveals capacity starvation, unfulfilled topology constraints, or failing probes:
sum by (namespace, pod) (kube_pod_status_phase{phase="Pending"}) > 0Progressive Delivery: Beyond Standard Rolling Updates
The native Kubernetes RollingUpdate strategy suffers from an inherent blind spot: it only inspects whether pods pass their readinessProbe. If a newly deployed version passes the probe but throws HTTP 500 errors to 5% of real user traffic, the rollout blindly proceeds until 100% of the fleet is broken.
Production platforms address this with progressive delivery operators like Argo Rollouts or Flagger:
[Current Stable Version] ---> 90% Traffic
                                    |---> Real-time PromQL Analysis (Error rate < 0.1% & P99 < 200ms)
[Canary Version (v2.4.1)] ---> 10% Traffic
                                    |
                           Metrics Breached?
                                   /      \
                             (YES)         (NO)
                              /              \
                 Instant Automated Rollback   Promote to 100%
6. Production Readiness Checklist for Engineering Teams
Before approving any workload for live production traffic, validate compliance against this operational checklist:
| Verification Area | Mandatory Technical Requirement | Status |
|---|---|---|
| Resources | CPU & Memory requests calibrated from real production telemetry. |
[ ] |
| Resources | Memory limits declared; CPU limits removed or thoroughly tested against CFS throttling. |
[ ] |
| Lifecycle | preStop hook with sleep 10-20 configured on all HTTP/gRPC services for endpoint draining. |
[ ] |
| Lifecycle | terminationGracePeriodSeconds sized generously (45-60s) to allow connection draining. |
[ ] |
| Healthchecks | startupProbe enabled for services requiring >10s cold-start initialization. |
[ ] |
| Healthchecks | readinessProbe isolated from external third-party dependencies (databases, external APIs). |
[ ] |
| Resilience | topologySpreadConstraints enforcing multi-AZ and multi-node distribution. |
[ ] |
| Resilience | PodDisruptionBudget configured (maxUnavailable: 1 or minAvailable: 50%). |
[ ] |
| Security | runAsNonRoot: true, readOnlyRootFilesystem: true, and capabilities.drop: [ALL]. |
[ ] |
| Security | Namespace NetworkPolicy active (Default-Deny + explicit ingress/egress allowlists). | [ ] |
| Observability | Prometheus alerts configured for CFS Throttling, OOMKills, and HTTP error rate anomalies. | [ ] |
Conclusion
Operating Kubernetes in production is not about memorizing kubectl commands. It is about understanding the fundamental contracts between the control plane, the scheduler, the Linux kernel, and the network data plane.
Implementing deterministic Requests and Limits, zero-downtime pre-stop hooks, multi-AZ topology distribution, and zero-trust runtime security transforms a fragile cluster into a robust, self-healing platform engineered to withstand high-concurrency production demands without 3:00 AM incident calls.